Predictive Water Operations
Unified water management software for large commercial building portfolios, uncovering hidden insights and risks in hydronic systems.
*Please note that the name “Marlin” is used throughout this page. This was the project codename prior to launch. The product is now called “Nexa.”
Context
Marlin is a centralized water management system for commercial buildings.
I led design on a cross-functional team, managing two junior designers from research through the Beta launch.
Why water management?
Water touches every part of a building, and when something goes wrong, it spreads fast. It’s the #1 source of property damage: about $500M a year.
Problems
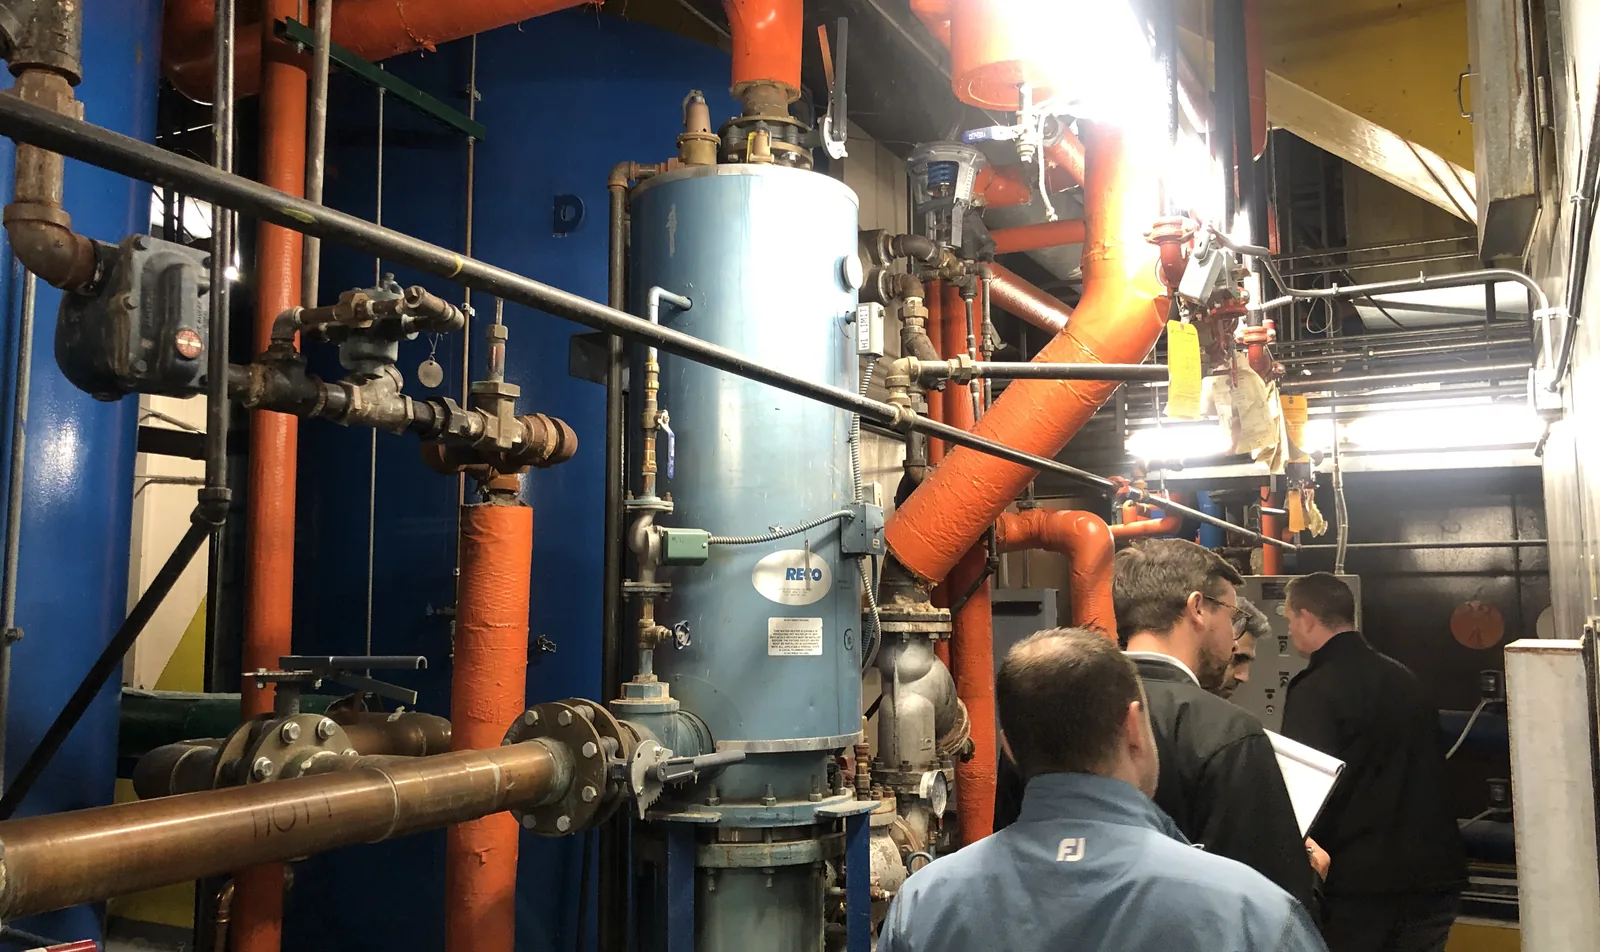
Routine checks are too time consuming.
Up to 6 hours a day walking mechanical rooms, just to confirm nothing was wrong.
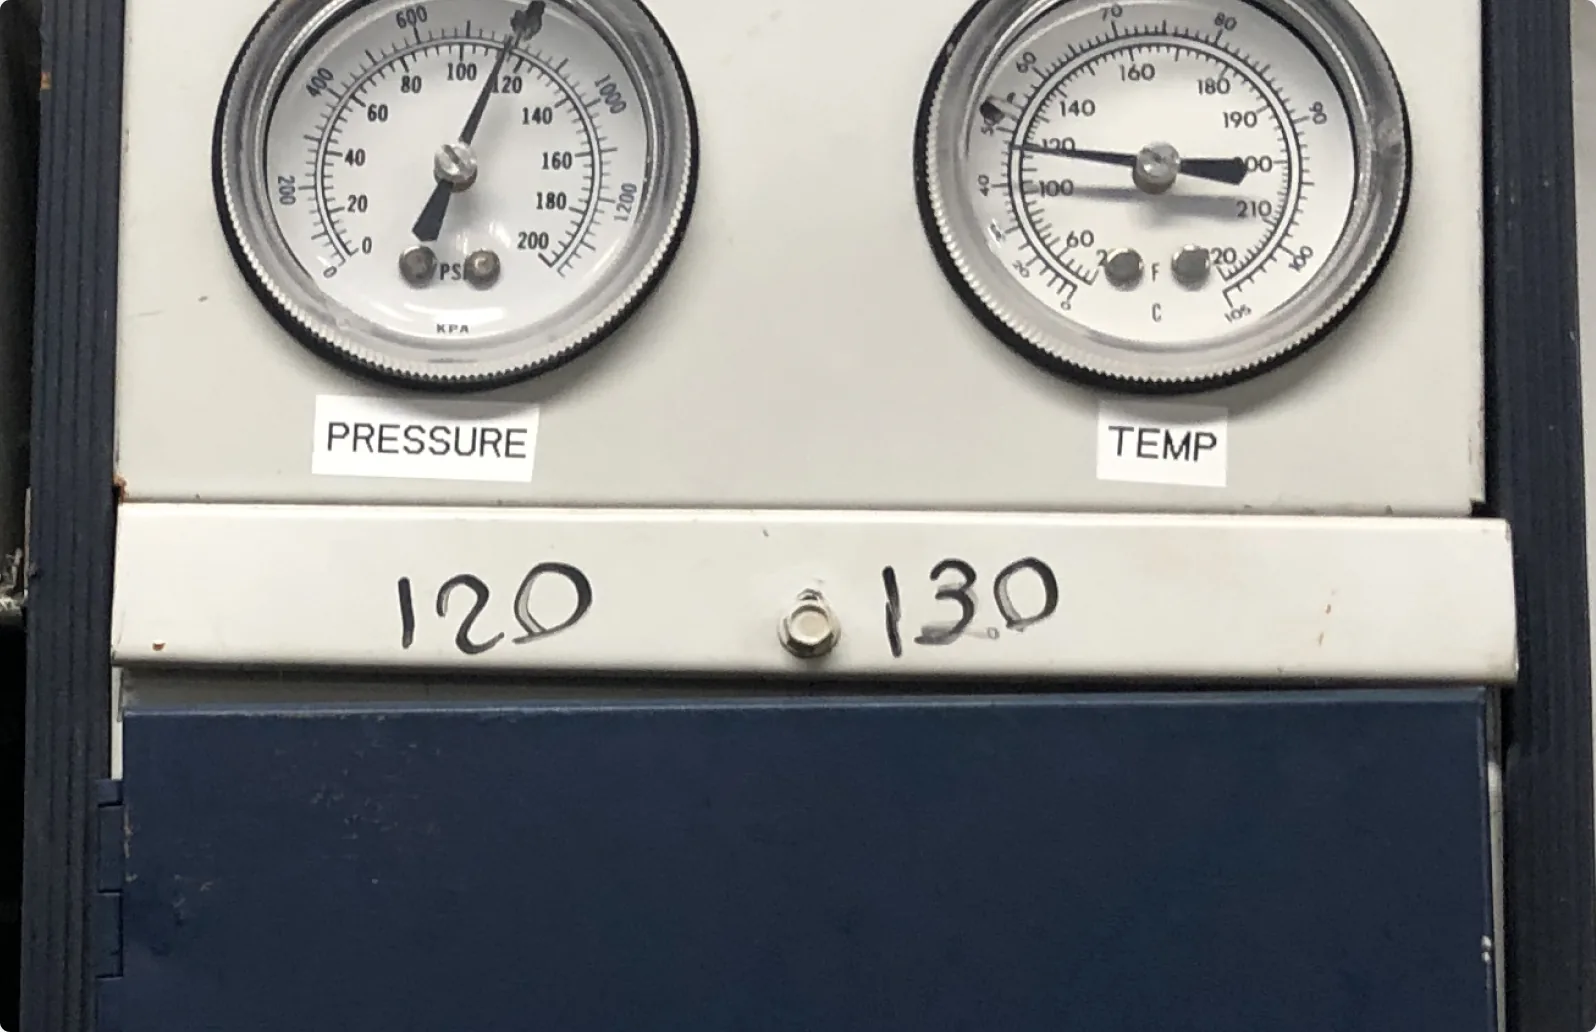
Extremely manual process.
Thresholds written on equipment with a sharpie. Readings logged on paper, then thrown away months later.
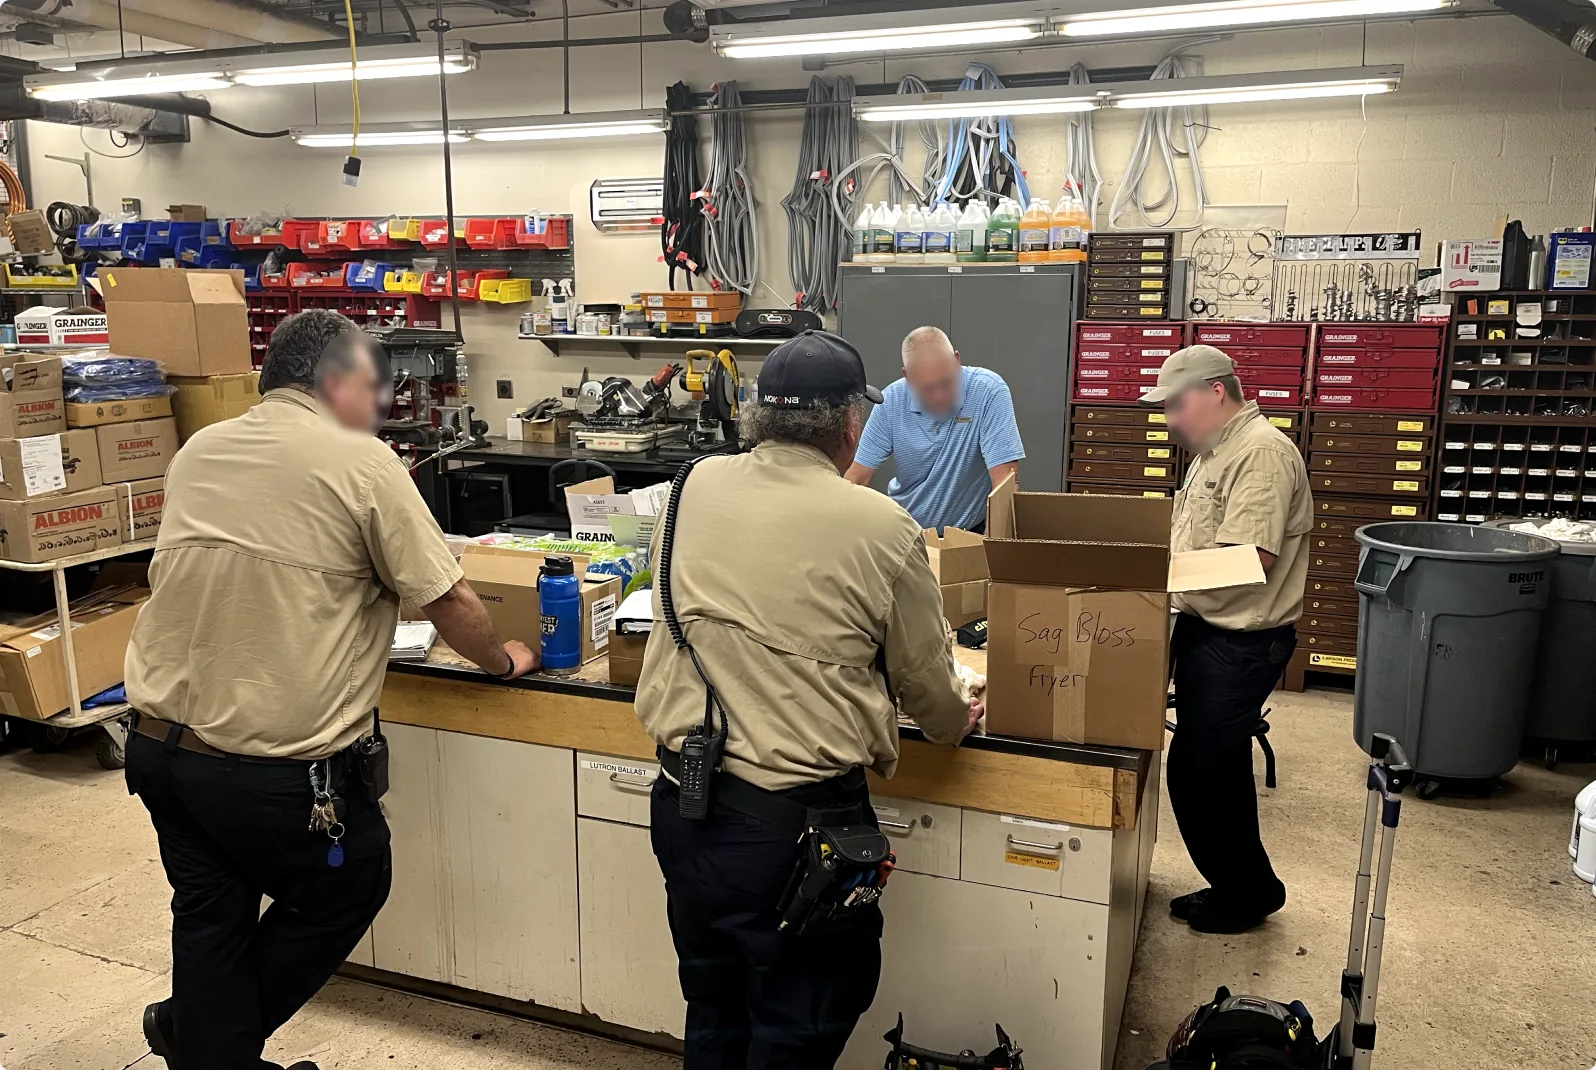
Scattered data, even with sensors.
Sensors came with an average of 18 separate software products, so many teams went back to manual checks.
“I feel like frequent monitoring in mechanical rooms is a complete waste of my time for very little risk.” - Building Engineer from anonymous property
Research
We interviewed and tested with engineers throughout, and I shadowed them on site.
30

Interviews with building engineers
14
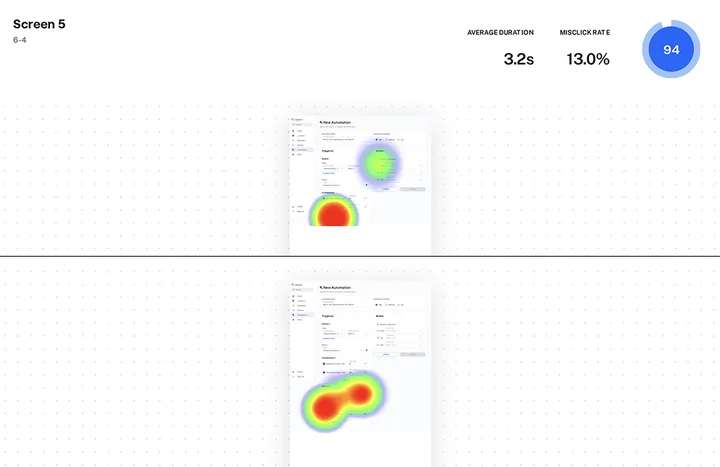
Usability tests across 6 different regions
3
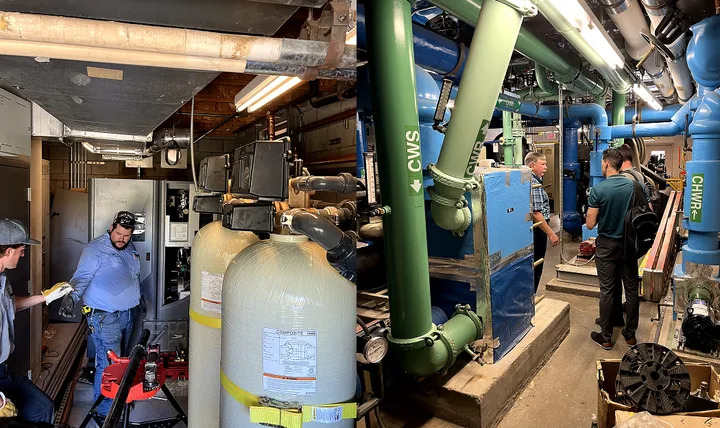
Properties shadowed in different states
Design approach
One unified view of the whole property, built around one question:
“Why should they trust this over walking the floor themselves?”
Reduce effort for everyday tasks
Key signals upfront, no digging required.
Prioritize for users
Surface what matters most to the property and user context first.
From reactive to proactive
Use historical trends to predict problems early, not just catch them when they happen.
Solution design
Dashboard
The homepage had to show what matters most at a glance, out of a massive amount of data. I tested three directions with users.
Option 1
Categorized insights
Alerts grouped by impact and insights. Too much interpretation by the system.
Option 2
Location-based
Building layout beside alerts. Confused with water flow, and hard to scale.
Chosen
Mechanical room view
Color-coded priority by mechanical rooms. Clearest in testing.
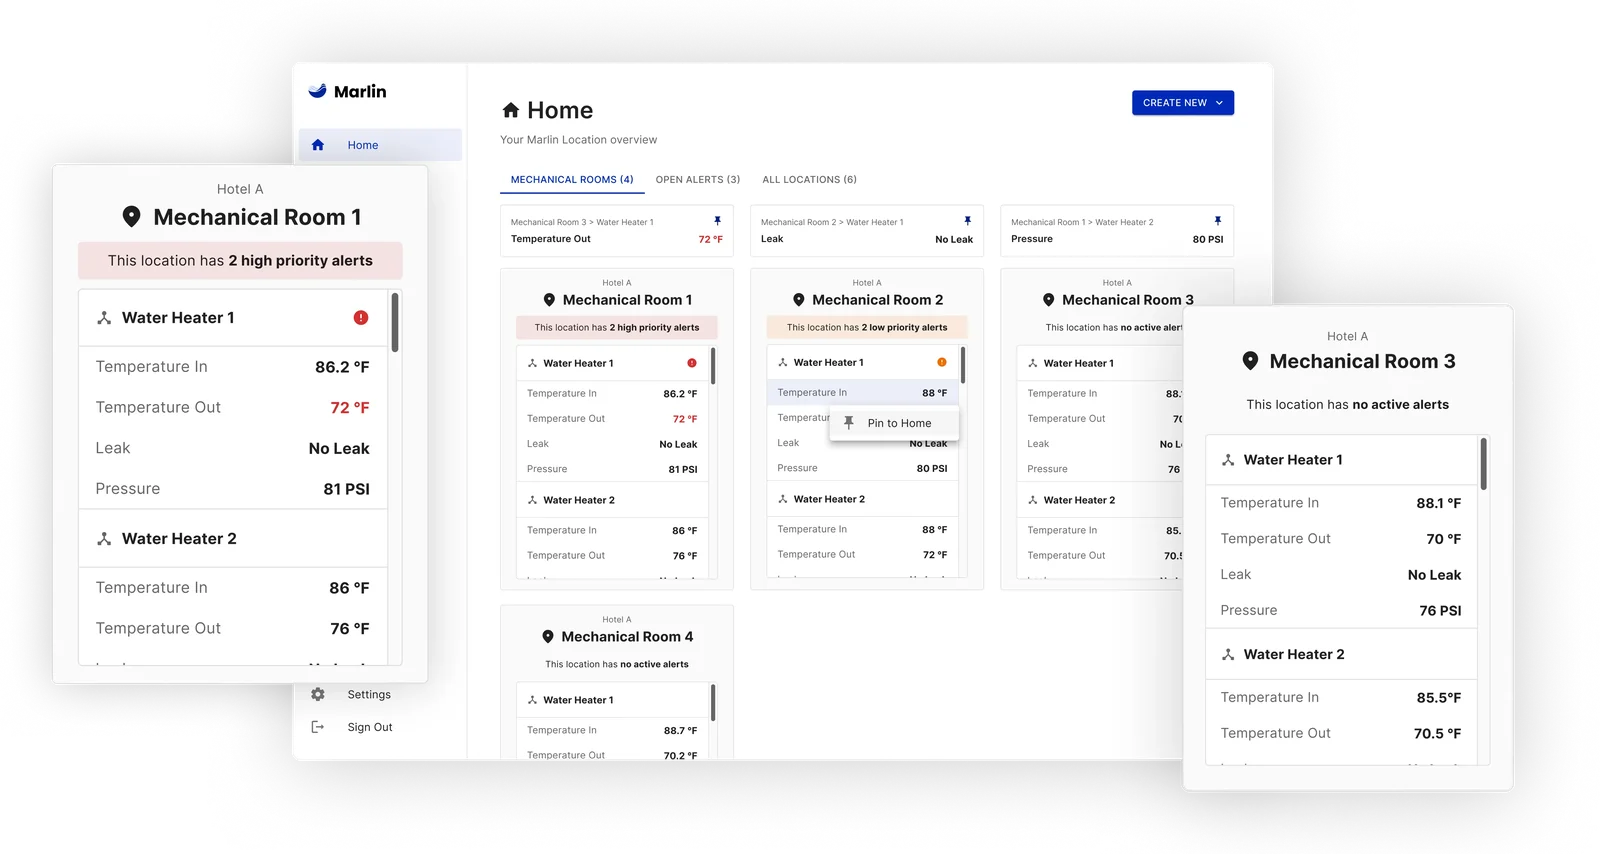
Mechanical rooms are the control center of a building’s water system, and how engineers divide work and plan their day. So the dashboard is mechanical room–first. Each card is a digital twin of each room: its equipment, the devices under it, and alerts on top by severity.
Water flow map
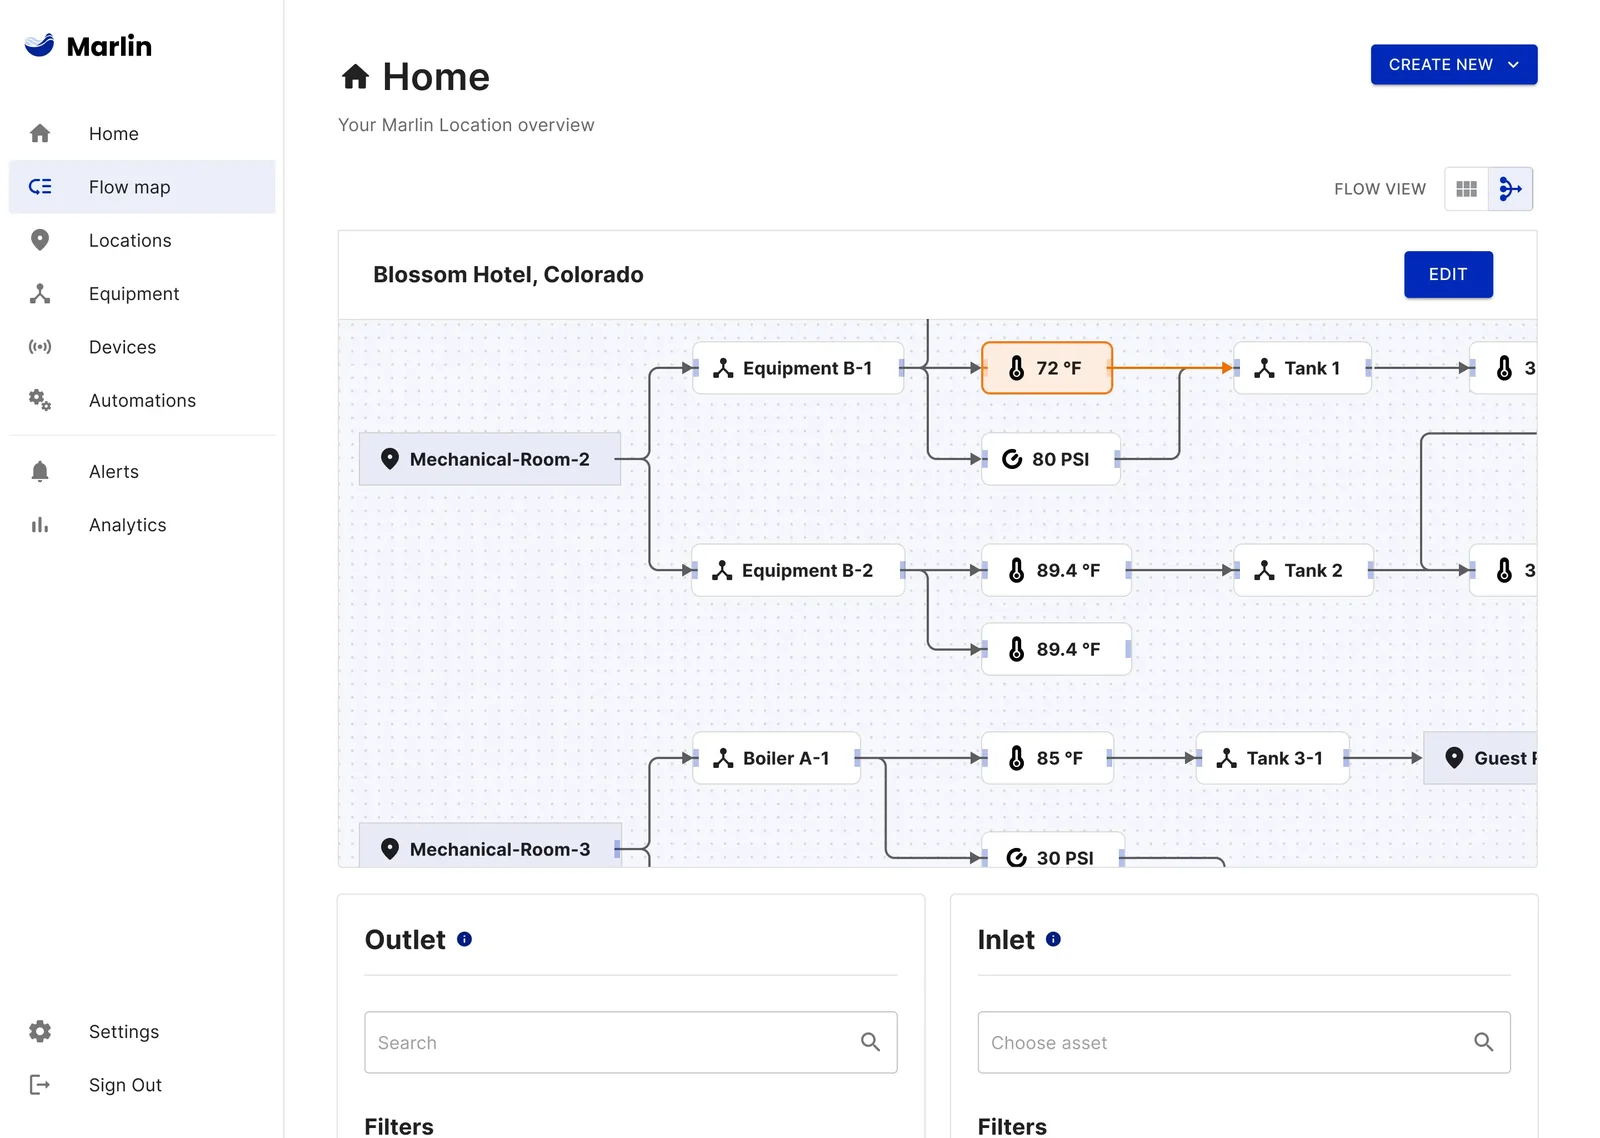
Water doesn’t follow the floor plan. One toggle away, the flow map traces problems upstream to their root cause.
Sensor widget
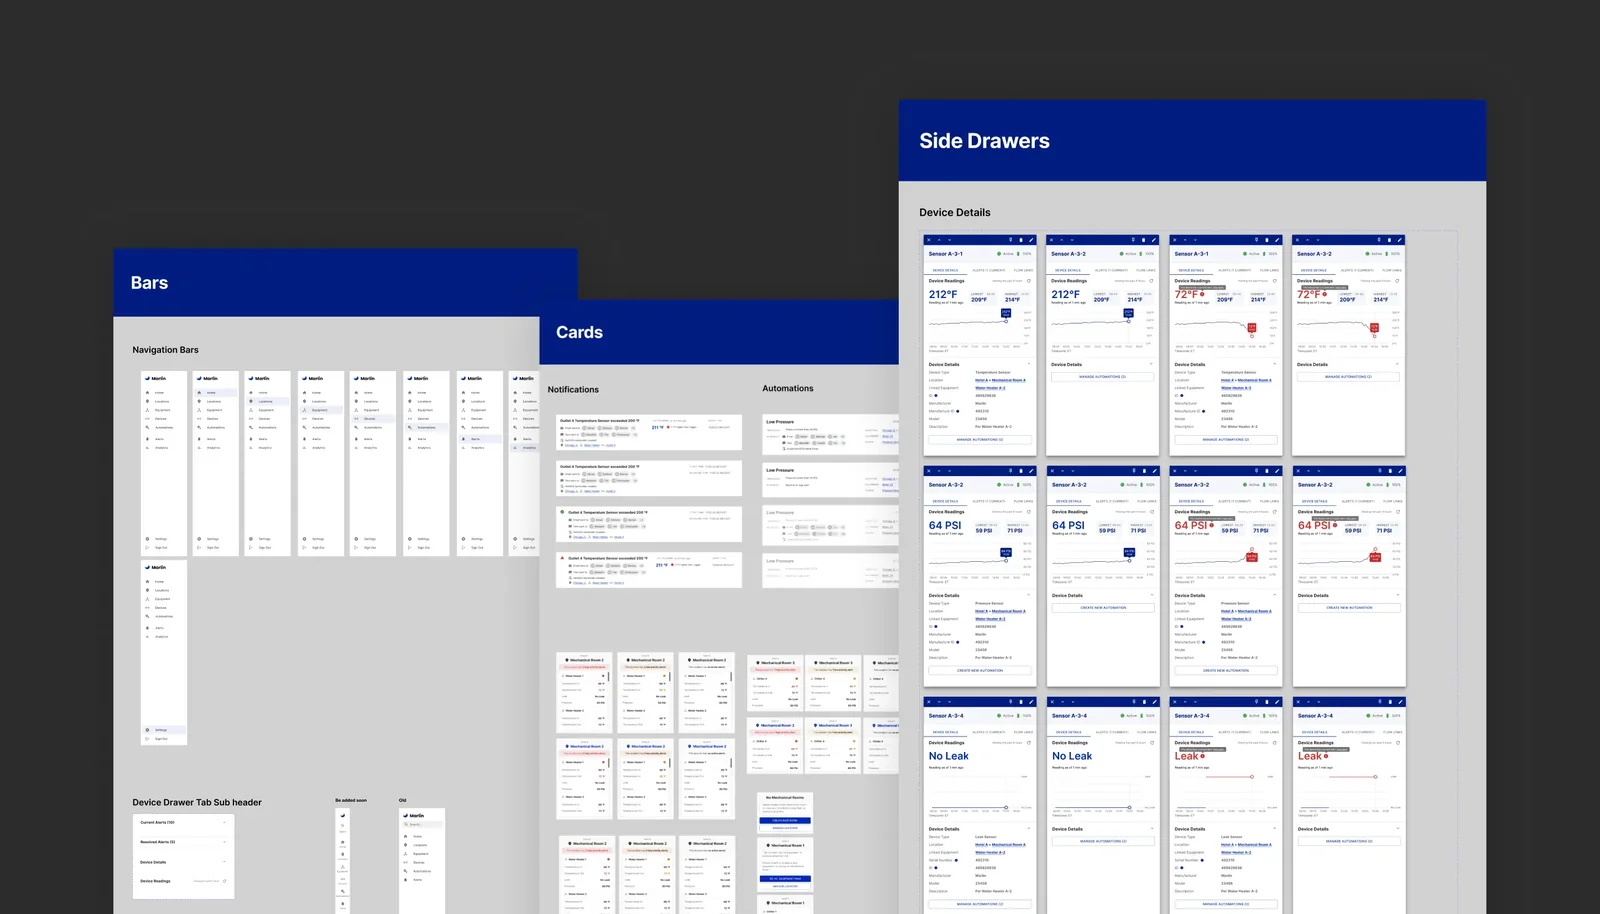
A side drawer opens any sensor from anywhere: current reading, trend with highs and lows, and alert thresholds.
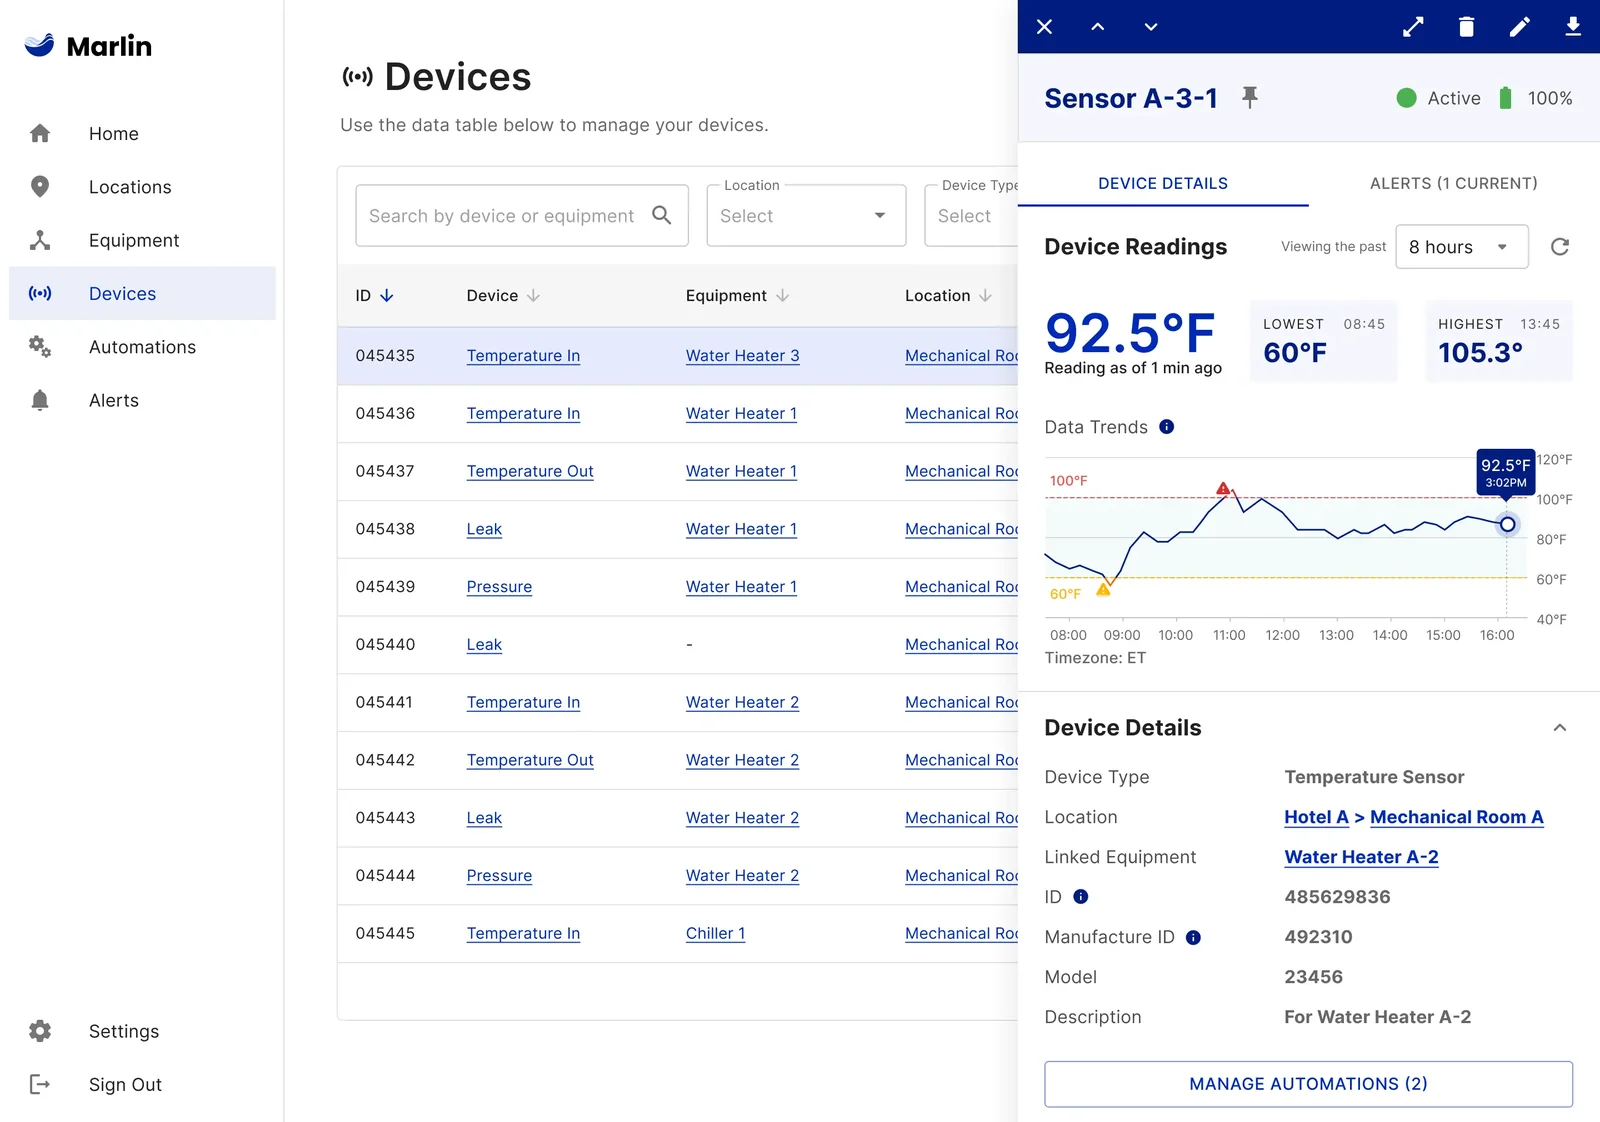
Experts found summaries like “guest rooms impacted by high water temperature” misleading. They want the pattern, and their own judgment. So I laid out the raw data and trends, not interpreted summaries. That choice increased trust and adoption.
Design system & principles
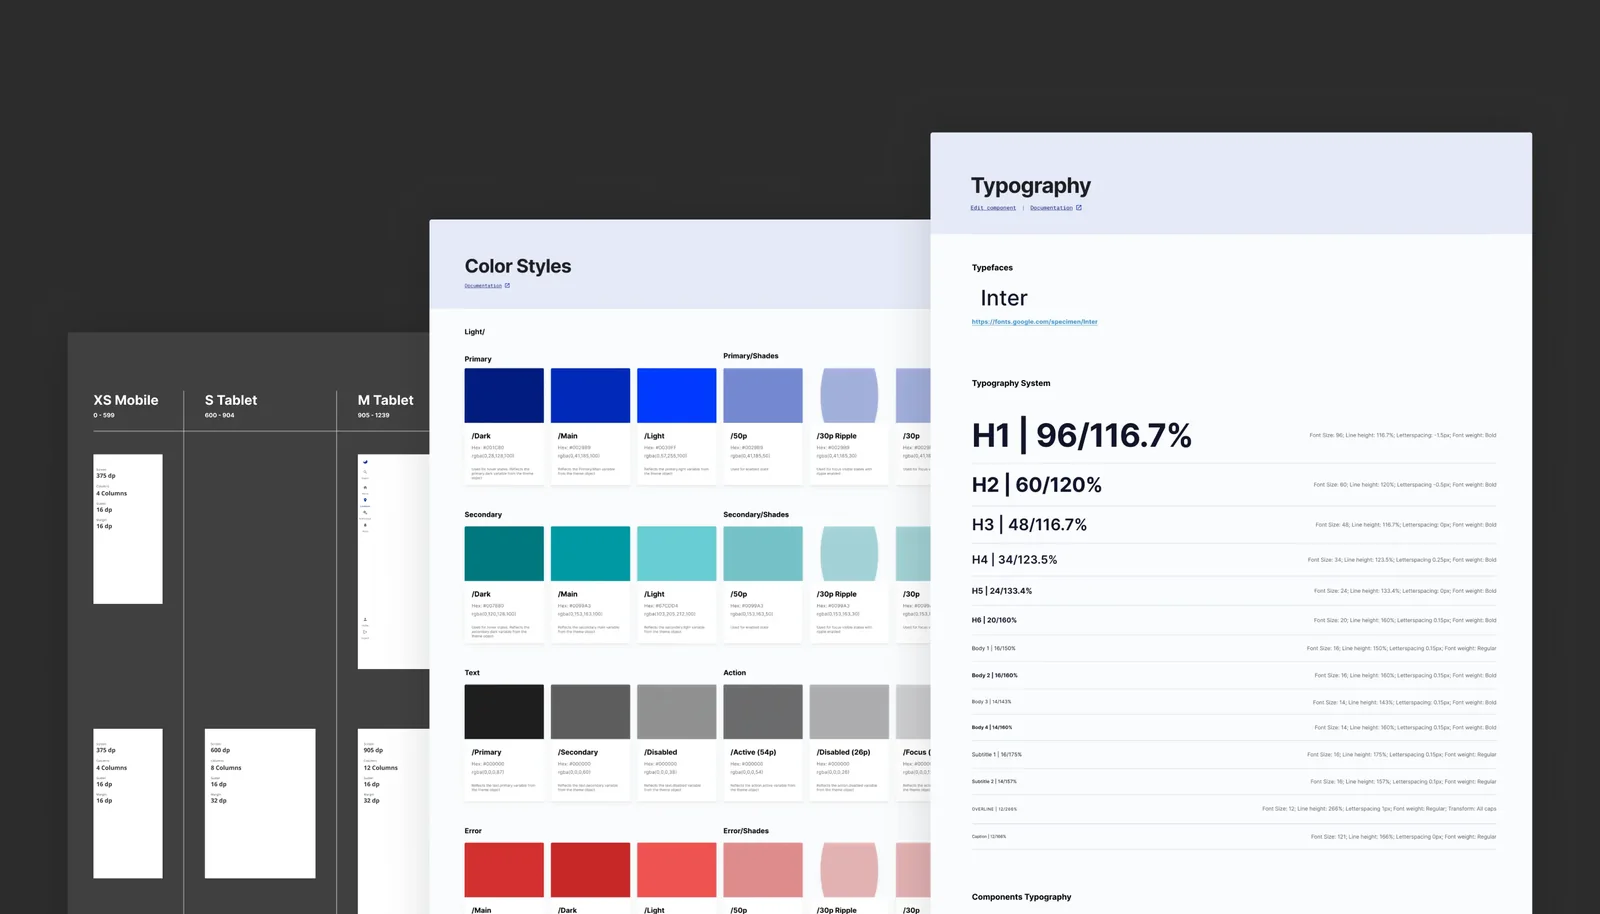
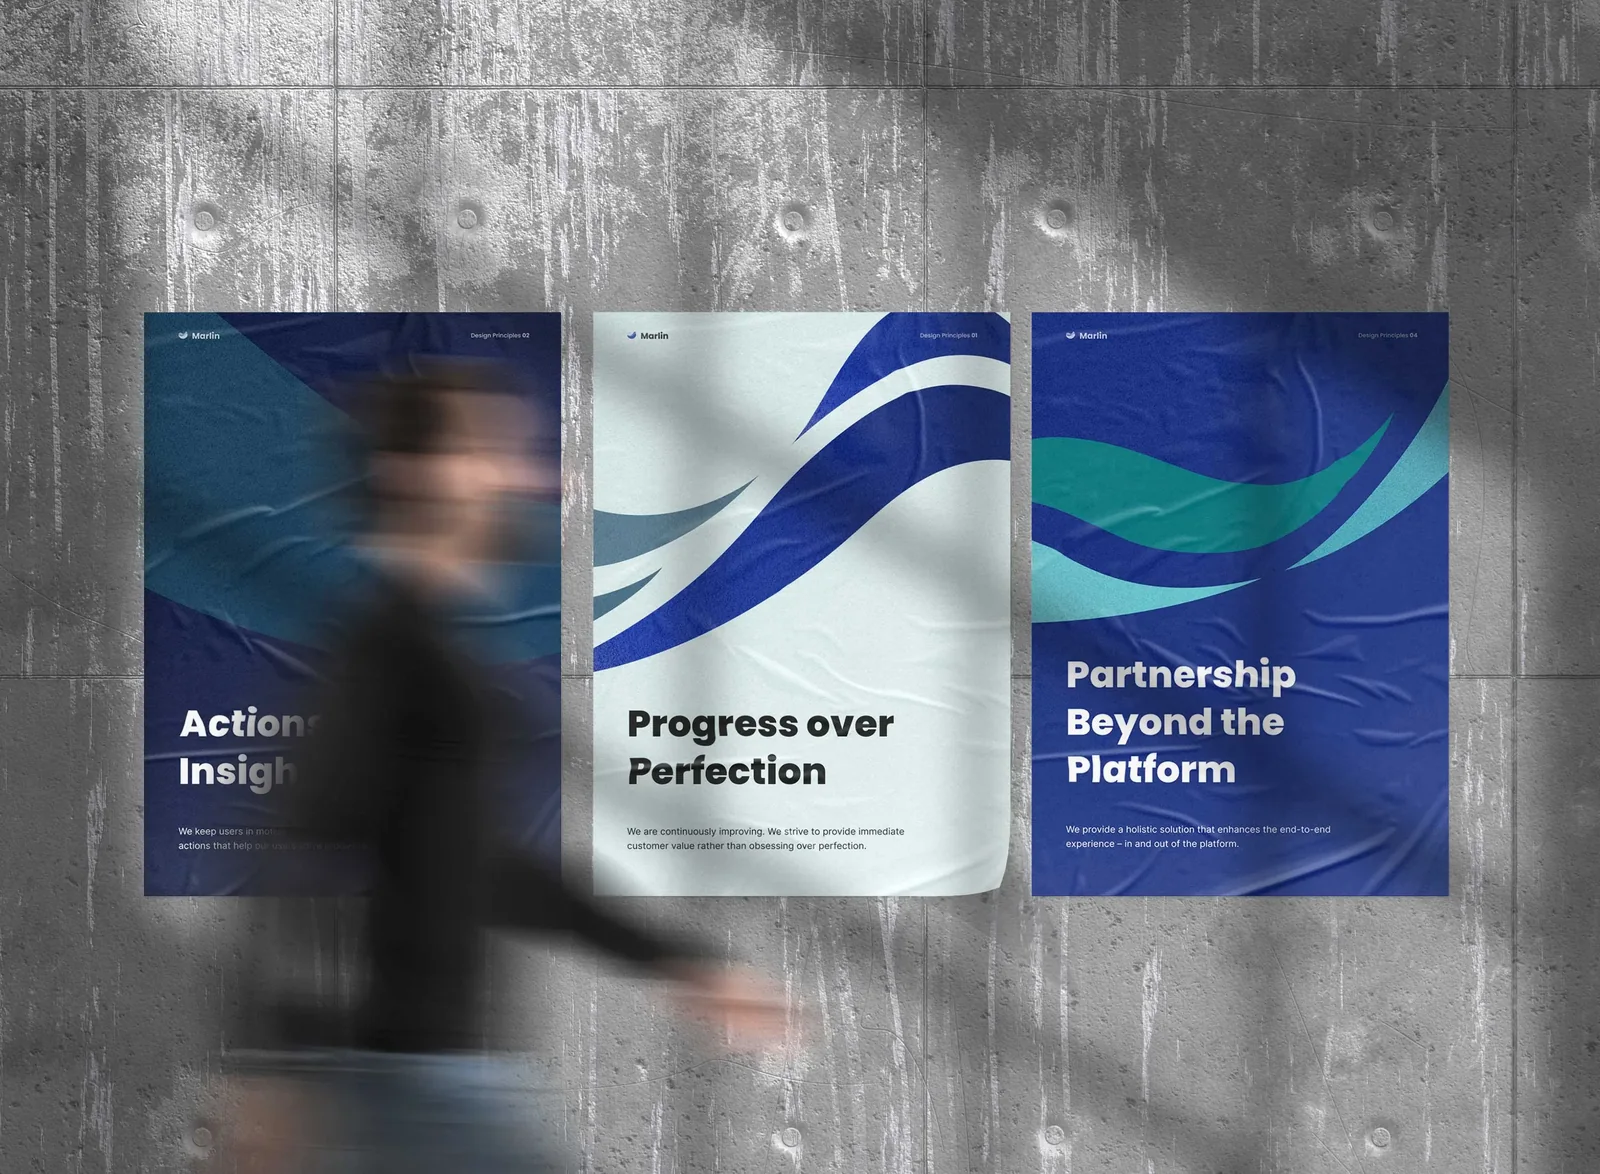
I defined and shaped the very first design system for a small team, so we could ship a consistent experience at speed, and a set of design principles, so every decision stayed focused on what engineers need most.
Impact
All 8 pilot users responded positively. After the Beta launch:
4.8average satisfaction score in the pilot
17%fewer customer complaints
$80Kannual savings per site